
Data-Driven AI - Power Platform Cost Governance
About Data-Driven AI
Data-Driven AI, a leading Managed Services Provider, needed a more scalable and user-friendly way to manage internal cost governance while maintaining compatibility with its existing Angular-based administration tool. As the organization expanded, administrators struggled with manual processes, inconsistent data structures, and the lack of a Microsoft-aligned interface for managing cost groups.
At the same time, financial and operational reporting suffered due to disconnected data sources — with profitability data in Xero and operational data in a separate enterprise dataset. This fragmentation limited visibility into utilization, billable hours, technician workload, and overall performance. MagnusMinds delivered a unified Power Platform solution addressing both challenges.
Our Approach
Challenge & Solution
The Challenge
The client faced two major challenges impacting governance and reporting. For cost governance administration: the existing Angular admin tool was functional but not user-friendly for broader distribution, administrators struggled with managing cost centers, ownership, descriptions, budgets, and governance consistency, and a smoother Microsoft-aligned interface was needed. For reporting: profitability data lived in Xero while operational data was in a separate enterprise dataset, causing fragmented visibility into utilization, billable hours, and technician performance — requiring a unified reporting model without disrupting existing dashboards.
Our Solution
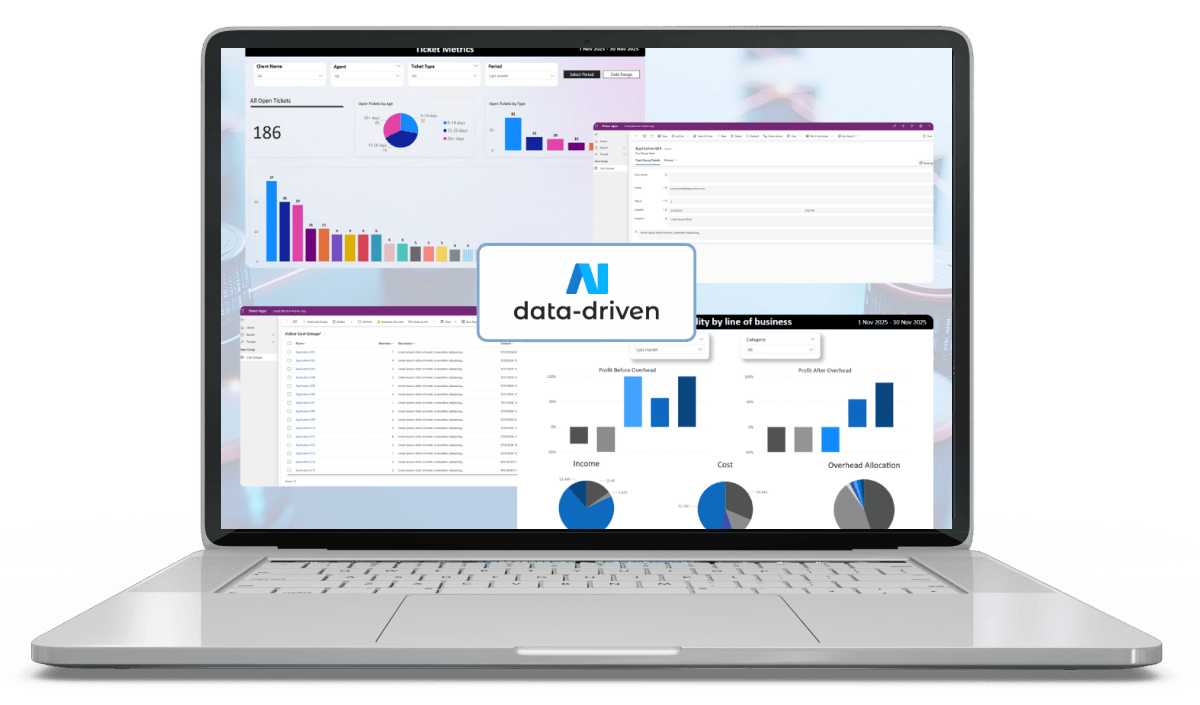
MagnusMinds delivered a streamlined Power Platform solution: PowerApps Canvas App built on Dataverse to complement the Angular tool, with list views, filtering, and detailed forms for cost center, purpose, ownership, and budget data, integrated Power Automate to commit updates reliably, and packaged as a managed solution published to the Azure Marketplace for easy deployment. For reporting: Xero data was integrated into the enterprise dataset while preserving existing reports, with visuals for income, cost, overheads, and profit by business unit, utilization KPIs including billable vs. non-billable hours, tickets per technician, workload distribution, and time trends delivered via unified Power BI dashboards.
What We Built
Key Features
PowerApps Canvas App for cost group administration on Dataverse
List views, filtering, and detailed forms for cost governance
Power Automate integration for reliable data commits
Managed solution packaged and published to Azure Marketplace
Power BI dashboards for income, cost, overhead, and profit by business unit
Utilization KPIs: billable vs. non-billable hours and technician workload
Impact
Results & Outcomes
Scalable PowerApps interface published to Azure Marketplace
Unified Power BI dashboards for finance and operations
Improved cost governance and administrative efficiency
Xero and enterprise data integrated without breaking existing reports
Clearer insights across profitability, utilization, and technician performance
Stack
Technologies Used
Client
Data-Driven AI
Industry
Managed Services / IT
Technologies
PowerApps, Power Automate, Power BI…
Have a Similar Project?
Let's discuss your requirements and build something extraordinary together.